
The huge market of plastic products has greatly promoted the development of plastic machinery industry, injection moulding machine has naturally become the key equipment for plastic moulding in modern industrial system. In recent years, injection moulding machinery has developed towards the trend of high speed and high precision, green and energy saving.
The key index to measure the productivity and control performance of injection moulding machine is the cycle time of opening and closing mould action. The cycle time, also known as the empty cycle time, refers to the time required for the closing mechanism to operate for one cycle without injection and pre-moulding action, specifically including the closing time, the opening time, and the changeover time between the closing and opening of the mould.
As shown in Fig. 1, the opening and closing actions are relatively independent in the whole production process, and reducing the time of this part of the action unrelated to the process can directly improve the production efficiency without affecting the quality of the products, and the study of the cycle time is of great significance to the improvement of the productivity and performance of the injection moulding machine.
To improve system rapidity, many experts have studied aspects such as valve spool structure, spring stiffness, and damping hole diameter. These efforts aim to enhance the control valve’s response speed and the system’s dynamic performance.
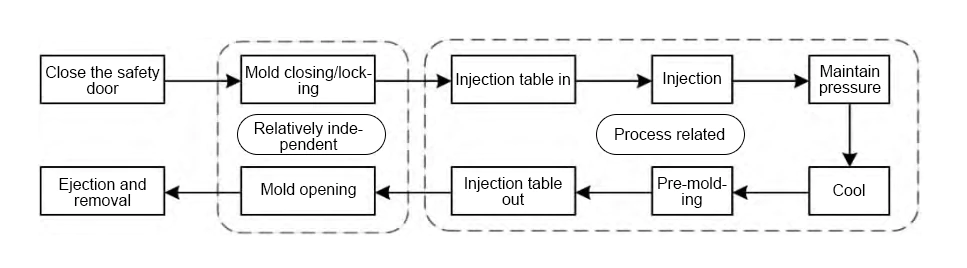
Figure 1 injection moulding machine working production flow
Opening and closing mould action principle and system composition
This study focuses on the opening and closing system of the three-plate hydraulic injection moulding machine, as depicted in Figure 2. During the closing process, it generates sufficient clamping force to ensure that the mould cavity is tightly sealed, preventing the plastic melt from overflowing during injection. After injection, it provides space for the ejector cylinder to eject the moulded products smoothly.
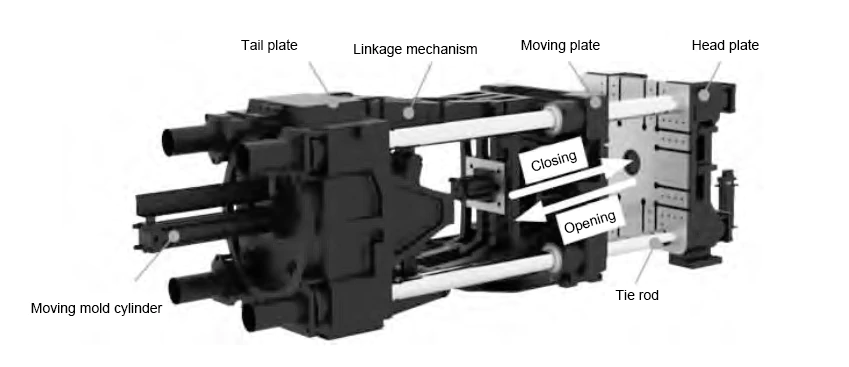
Fig. 2 Mould opening and closing structure of injection moulding machine
The three-plate hydraulic injection moulding machine uses a mould opening and closing system with four main parts. These include an electrical control system, a hydraulic transmission system, a mould mechanism, and a lubrication system.
The hydraulic system under study belongs to the servo pump control system, and the control logic is the composite control of ‘servo pump control + hydraulic valve control’, i.e., the servo driver sends out a speed command to the motor, drives the oil pump to rotate, and then supplies the oil to the system, and the flow value of the output of the oil pump is only related to the speed of the servo motor.
By adjusting the valve control logic, switch to different working oil circuit, and then complete the opening and closing of the mould process of different sub-action.
Study on the influencing factors of mould opening and closing cycle time
The rapidity of the mould opening and closing system determines the cycle time performance. The electro-hydraulic servo system’s rapidity is influenced by three factors. These are the pressure building time, the dynamic response of components, and the actuator’s working speed. We investigate the impact of these parameters on the system’s rapidity. From these findings, we derive countermeasures to reduce the cycle time.
1. Elastomer pressure building time
Fluid and pipeline are typical elastomers. During the high-pressure clamping stage, pressure increases cause elastic deformation in these components. This deformation forms a dynamic cavity inside the original closed space. A certain volume of working fluid must be replenished to fill the cavity. This process causes time loss in the elastomer pressure build-up phase.
High-pressure clamping stage, the oil is intensely compressed, the cylinder inlet cavity appears dynamic volume, then compensate for the part of the oil to be supplemented:

Formulas 1.
Where: Vs for the cylinder and high-pressure hose initial volume, m3;
Force rate of change, N/m; Δx for the cylinder displacement, m; A for the cylinder working chamber area, m2; βe for the volume of the fluid modulus of elasticity, MPa.
Compensate for the dynamic volume of the pipeline to be supplemented by the oil:

Formulas 2.
Where: r is the radius of the working surface of the pipeline, m; ΔFx is the deformation resistance, N; k‘ is the pipeline stiffness, N/m; Δx’ is the pipeline path directional deformation, m.
In summary, the additional pressure building time caused by elastomer deformation is:
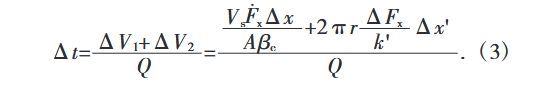
Formulas 3.
Where: Q is the oil supply flow rate, m3/s.
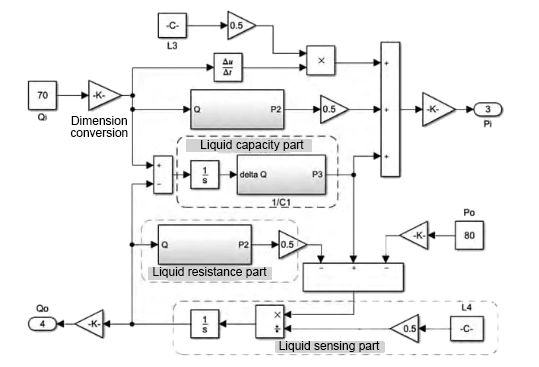
Fig. 3 Simulink simulation model of high-pressure hose
We first construct the high-pressure hose simulation circuit as shown in Figure 3 and input the key parameters into the model. Then, we simulate different pipe diameters, lengths, and initial volumes. The results are shown in Figure 4.
The curve in Figure 4 indicates that as the initial volume increases, the pipe pressure oscillation effect diminishes. It takes longer for the system to build pressure and attain a stable state. The figure label L represents the initial volume.
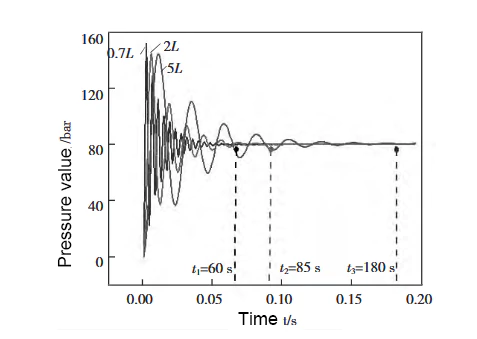
Fig. 4 Pressure building time of elastomer under different initial volume.
2. Dynamic characteristics of hydraulic components
2.1 Dynamic Response of Motor Pump
As illustrated in Fig. 5, we model the motor pump using the MATLAB/Simulink platform. The response time of the motor pump is determined by the time interval t1 between the command signal received by the servo driver and the subsequent output speed of the servo motor.
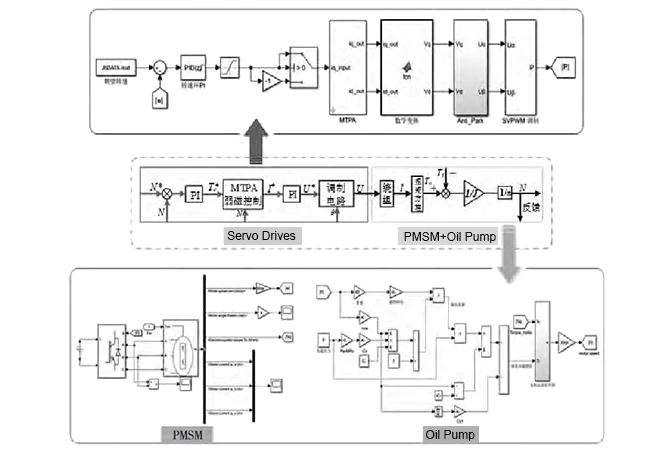
Fig. 5 Simulink simulation model of servo drive unit
After iteratively debugging the Kp and Ki parameters in the rotational speed PI closed-loop control algorithm, we provide the rotational speed combinations for step-up and then step-down scenarios. The rotational speed initially increases from 0 r/min to 500 r/min, 1000 r/min, and 1500 r/min, respectively. Then, the rotational speed decreases back to 0 r/min in each case.
We process the obtained data and present the simulation results for the speed step-up and step-down settings in Table 1 and Table 2, respectively.
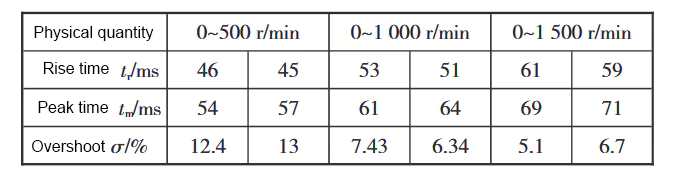
Table 1: Simulation results for step-up speed setting
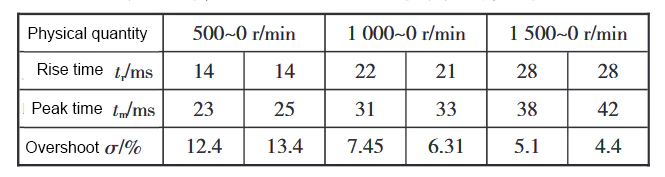
Table 2 Simulation results for speed step down condition
The simulation results reveal the time interval t1. This spans from the receipt of the command signal by the servo driver. The interval lasts until the output speed of the servo motor is achieved. The duration of t1 is between 45 and 70 milliseconds. During this period, there is no output speed from the motor. This represents an invalid time for the opening and closing actions.
2.2 Control valve response
The response characteristics of the control valve group directly affect the opening speed of the element.
The oil needs to pass through the switching valve and the safety valve. These are two control valves. The oil then enters the rodless cavity. The valve group’s response directly affects the oil’s entry speed. Therefore, the response time of the valve group is analyzed.
2.2.1 Changing the spring stiffness of the main control valve control chamber
The spring stiffness of the control cavity greatly affects the spool’s switching speed. Three stiffness values are selected: 11.6 N/mm, 21.6 N/mm, and 31.6 N/mm. These represent different conditions for evaluating the switching speed of the spool.
Observe the spool displacement change of the main control valve, as shown in Fig. 6. The simulation curves show the spool’s transition from right to center. A greater spring stiffness results in a faster switching rate. It also causes a higher spool oscillation frequency.
2.2.2 Changing the control oil flow rate
We set three constant flow sources with values of 80 L/min, 100 L/min, and 120 L/min as inputs to the system, and present the simulation results in Figure 7-1.
The outlet flow response of the control valve group becomes faster with the increase of the control oil flow value. The original circuit is an internal control method, so the overall dynamic response can be improved by setting the external control oil port and increasing the control oil flow.
2.2.3 Changing the safety valve control chamber area
The size of the control pressure on the spool is influenced by the area of the safety valve’s control chamber. We set the control chamber diameters to 30 mm, 34 mm, and 38 mm, respectively, and the simulation results are shown in Figure 7-2.
The smaller the area of the control chamber, the smaller the hydraulic control force. The control chamber volume is also small. So the time required for the oil to fill the control chamber is shorter. The flow response of the valve group is faster. The oil enters the cylinder more quickly.
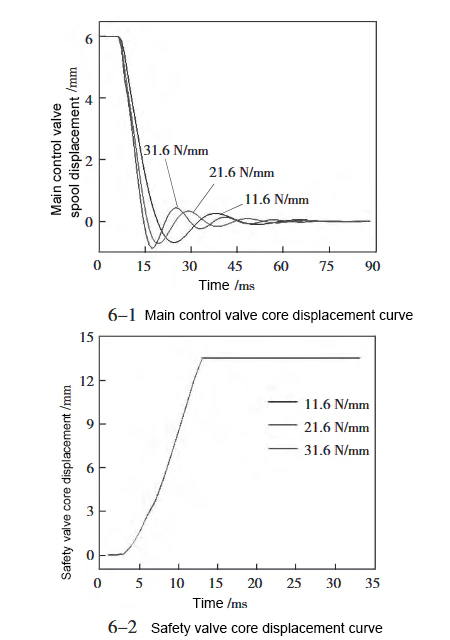
Fig. 6 Response of valve group under different spring stiffness of main control valve
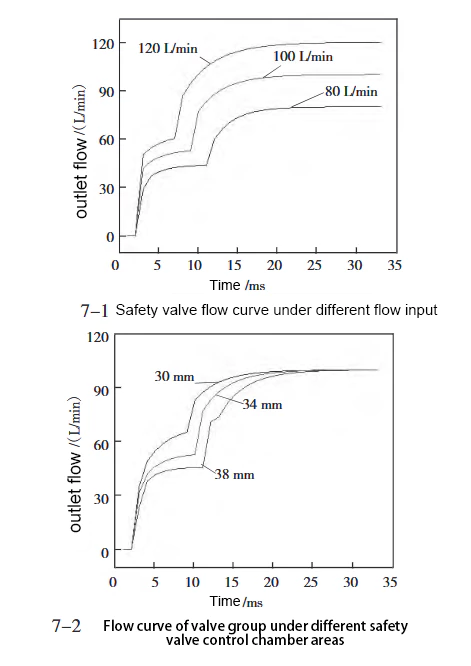
Figure 7 Safety valve manifold flow
Conclusion
Taking the mould opening and closing system as the research object. The system belongs to an injection moulding machine. The study focuses on how pressure building time affects system rapidity. It also considers the dynamic response of the components. The analysis is based on the cycle time of mould opening and closing.
Reducing the initial volume of the cylinder helps shorten the elastomer’s pressure building time. Reducing the volume of the connected high-pressure hose also has the same effect. However, the system takes longer to build up pressure. It also takes more time to reach a steady pressure state.
The response characteristics of the motor pump and control valve group and the parameters of the control valve group model all influence the rapidity of the system.
Improve the injection moulding machine opening and closing system rapidity can take the following measures:
(1) According to the actual demand, try to reduce the initial volume in order to improve the system rapidity;
(2) Reduce the response time of the motor pump can improve the rapidity;
(3) Improve the spring stiffness of the main control valve. This increases the control oil flow. Reduce the area of the safety valve control chamber. Change the parameter values of the control valve group. These actions improve the speed.